The following was originally Katie McCurdy’s response to the excellent, ongoing discussion about the future for self-tracking. It’s too good not to elevate to a post of its own — Susannah.
____________________________________________________________________________
Katie’s self-crafted medical timeline (Click to enlarge; see story below)
")
There is some recent thought that self-tracking or data gathering is “a manifestation of our profound self-absorption.” Sure, self-tracking is all about ‘me,’ (hence the word ‘self’) but there seems to be an undertone that people are motivated to track their data by vanity or narcissism. This may be true for some people, but there are others who are motivated by true medical necessity – diabetics needing to track their blood sugar, or people suffering from unexplained medical mysteries. I fall into the second group.
For the past 20 years I have had Myasthenia Gravis, an autoimmune disease that causes weakness. For the past 14 years I have been taking Prednisone, a corticosteriod, to suppress my immune system to help reduce my Myasthenia symptoms. Unfortunately prednisone causes a host of side effects. For the past 5 years I have been experiencing gastrointestinal problems (debilitating at times) and increased weakness. I have been to neurologists, a number of gastroenterologists, acupuncturists, and a few primary care doctors, and NONE of these folks were able to really explain what was happening to me or give me concrete advice for improving my condition.
As I was getting ready to see a new doctor, I realized that the best way to tell my story would be to create a medical “life story” timeline that reflected:
- The course of my autoimmune disease
- Severity of my gastrointestinal problems
- Key moments in time when I started and stopped certain medications or took antibiotics
- Any significant dietary changes
I sketched out the two timelines (autoimmune and gastrointestinal) separately, and then created them electronically using Adobe Illustrator. (I’m an interaction designer by day, so fortunately I had the skills/know-how to create a somewhat legible artifact.) I used a peach color to represent gastrointestinal wellness/symptoms, and a blue color for Myasthenia Gravis.
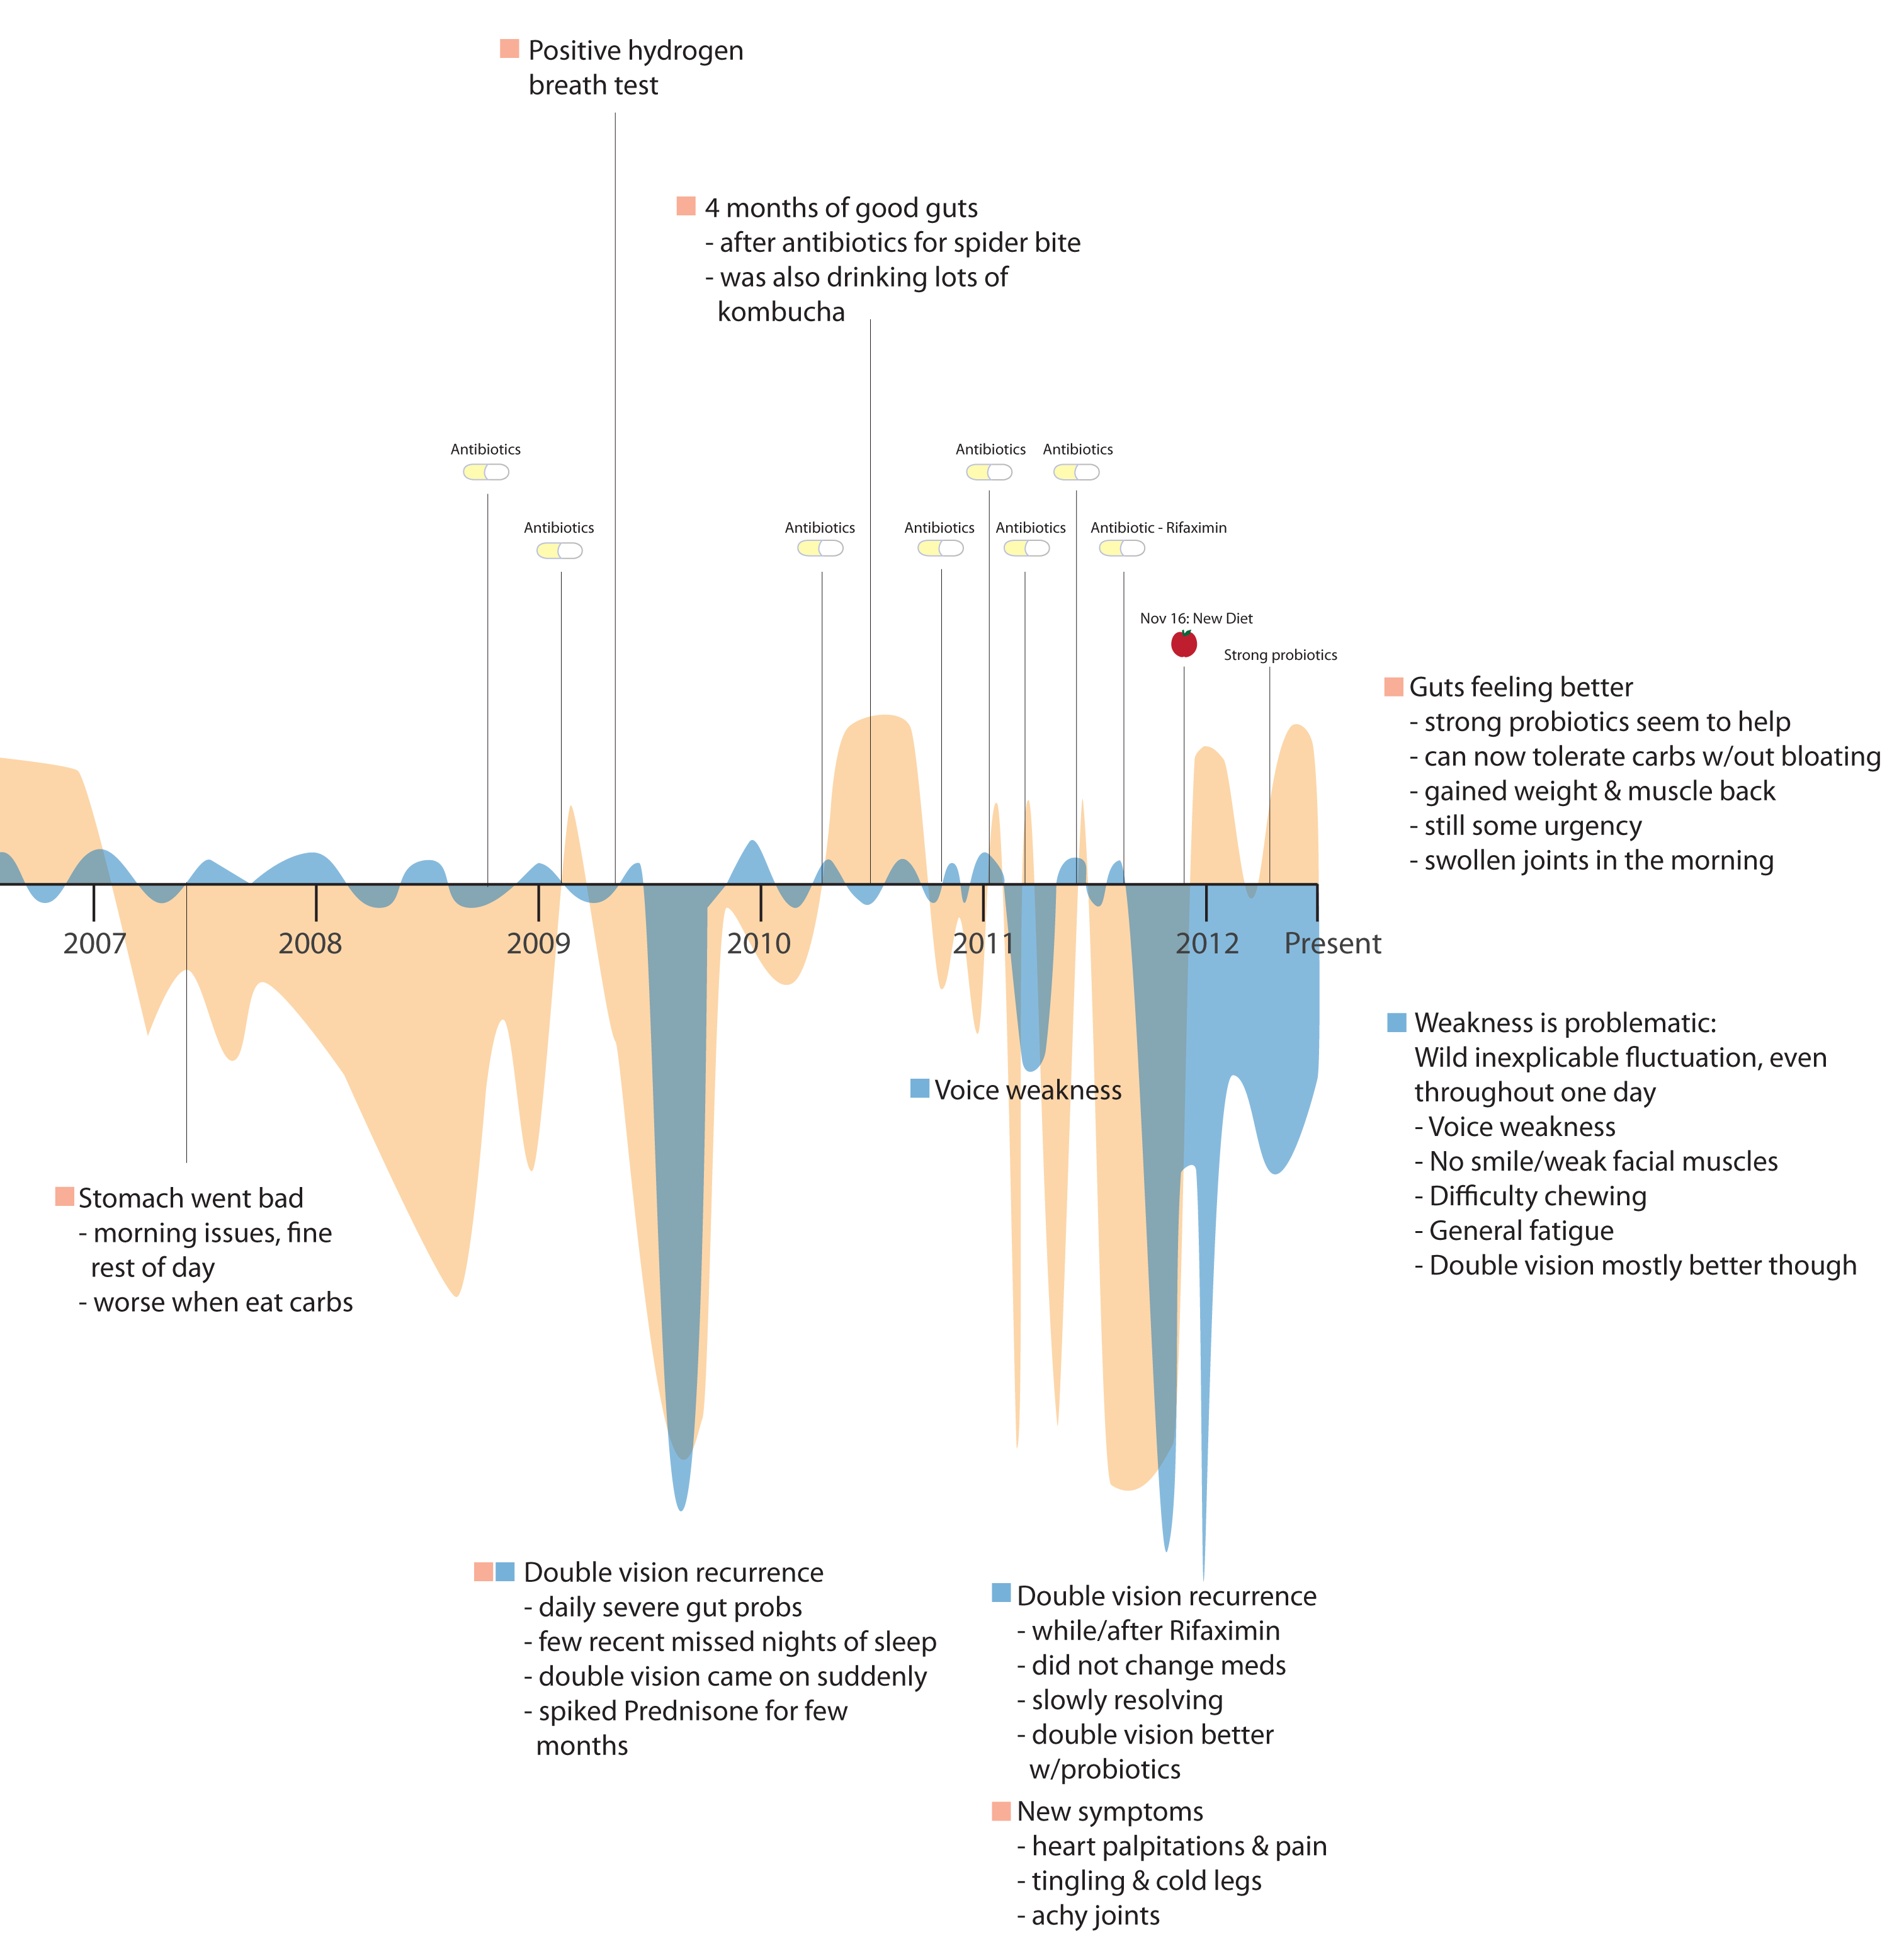
Close-up of recent years showing relation of flare-ups (click to enlarge)
An important note – I did create my timeline from memory. I clearly remember, almost to the day, when my severe flare-ups happened. Like others, I have had a very hard time motivating myself to track my data daily and I don’t think I can bring myself to actively do it; until passive data collection exists for my specific disorders (or until I come up with a mechanism to force myself to track how I feel each day) I might have to just work from memory.
After I completed the timeline I printed it and took it to my doctor visit.
I can’t say the doctor was overjoyed at first to see a patient-created chart, but he listened intently as I used it as a storytelling prop. It definitely helped me quickly and coherently communicate what’s been going on with me, and when I asked him if he found it useful, he said it was helpful to get him up to speed on my story. Read more about my visit on my blog.
Last month I attended the Brainstorming Design for Health workshop at the Computer Supported Cooperative Work conference, and had the opportunity to show a print-out of the timeline to another doctor. He said that most doctors inwardly groan when a patient comes in with excel data, charts, graphs, and the like – mainly because patient data may not be totally accurate, and doctors don’t want to have to take the time to learn and understand another type of documentation or visual language. But after I gave him a few seconds with the timeline, he became very excited and animated and said this was something he could understand immediately; it could actually save him time in the exam room. The main lesson I’ve taken from that experience is that there is a definite need for a patient tool that would allow them to create legible, clear, communicative visualizations (perhaps even exploratory data visualizations on a tablet or phone) so that they can:
- Better understand what is happening to them and how what they do impacts how they feel
- Better communicate with health care practitioners
Let’s face it, even if a doctor is wary of a patient-generated timeline, if that artifact makes the storytelling process easier for the patient & more coherent for the doctor, it adds a lot of value even if the doctor doesn’t want to take time to carefully analyze it.
So what are the outcomes from this experience?
My new doctor has helped me resolve my most serious stomach issues, and it has been awesome to have some relief after years of discomfort and anxiety.
I can say that visualizing my history has helped change my behavior. Seeing the high number of times I took antibiotics in a short time period, and learning from my doctor that such repeated use of antibiotics causes overgrowth of yeast and bad bacteria, has helped me escape the antibiotic trap. Whereas a year ago I was calling my doctor for antibiotics every few months (they helped, but only for a month or so), now I work on adhering more carefully to a no-carb diet.
My goal is to keep pursuing this idea and work toward creating a tool for patients so they can at least assemble their own health timeline, and perhaps even track their data more regularly. I am holding interviews with patients, patient caregivers (or parents), and people who are active self-trackers; if you are interested in donating about 30 minutes of your time, email me at kathryn.mccurdy at gmail.com.
Here are links to the 2 blog posts I wrote about my experience w/this timeline:
How visualizing health problems could help solve medical mysteries
Medical history timeline: a tool for doctor visit storytelling
Finally, if anyone is going to be attending the Healthcare Experience Design conference in Boston on 3/26, let me know! I would love to meet you!
More about me:
- katiemccurdy.com
- Twitter @katiemccurdy
_________________
Note from e-Patient Dave –
- See also our November post by Kenneth Spriggs, The Benefits of Visualizing Your Medical Data.
- Look at this extraordinary patient-created visualization. Is this an engaged self-tracking patient, or what? I can’t wait for the day when new-wave software helps visualize this kind of pattern automatically. Until that day, we learn from examples like this – created by brilliant patients who see new possibilities.


This is incredible. Thank you for sharing! I believe with all of my heart that this is the future of medicine itself: visual patient narratives at the point of care. The alternative has always been our patient voice alone, but in the 15 minute clinical encounter, this is far more persuasive. Personally, I think this is exactly what Steve would have wanted for the iPad in health care. Would love to connect in Boston, if I can actually make it out!
Thanks Nikolai! Looks like you are doing some awesome work too…hope to see you in Beantown if you can make it!
Katie and Susannah, thank you for sharing this. For me, brought to light something neither sufficiently articulated nor acknowledged: participatory epatients often have more than one health issue to manage. Along with self-tracking those issues, it also means staying on top of and juggling healthcare professionals. Exhausting.
True or false:
There have always been patients like Katie, who try to figure out what’s going on with their health. It’s just now that they have tools to polish up and express their observations in engaging ways. It’s just now that clinicians are ready to listen to and even welcome such patients.
Katie, if the above is true, can you comment about your own experience? That is, is it only recently that you have both found the right tools and the right clinicians (who are interested)?
I’d love to hear from anyone else who has tracked symptoms – including more rudimentary displays. How have clinicians reacted?
And clinicians: if you are observing a shift, in yourself or in your colleagues, why do you think that is?
Is the heat just being slowly turned up on all of us so that we, without thinking about it, are becoming more visually oriented?
Are we all frogs being boiled in Apple’s soup? Or maybe that’s just torturing the metaphor, if not the frogs.
I think that’s right – patients have always used tools to document how they’re doing, but often it’s been notes written on paper, or perhaps excel spreadsheets. I never really even thought of trying to track how I was doing on a daily basis or create a visual representation until I ran up against a big problem: how to quickly communicate my complex 20-year medical history to a new doctor.
In my case, I realized I had the tools and expertise already to do this on my own. I have been very interested in data visualization for a number of years, and even went to a data vis conference (the eyeo festival) last year. One day it just hit me that I can use data visualization to tell my story. If it took ME this long to figure it out, I imagine it wouldn’t even occur to most patients.
So far I’ve shared this timeline with three doctors: this holistic doctor I’ve been going to, my neurologist, and a urologist who I met at a conference recently.
The first doctor didn’t really engage with what I showed him, though he did listen as I told my story and he watched as I pointed to certain places on the timeline. As I mentioned in my blog posts, I think having the artifact helped me to tell my story much more coherently. I left the print-out behind and they put it in my file. I’ve been back a few times in the interim, and I’m happy to see it poking out of the side of my paper file when we meet.
The second doctor, my neurologist, actually took a little more time to explore what I was showing him – I brought it in on my ipad (because I didn’t have time to print it) and he was pinching to zoom in and look at certain key moments on the timeline. He commented that it seemed like there may be a correlation between the times when my weakness and my stomach problems became worse. I thought that was pretty cool that he took an interest.
The third doctor was the urologist I mentioned in my post who was at the CSCW conference, and who was very excited about the potential.
So the reception from doctors has been varied, but the reaction from patients and caregivers who I’ve shared this idea with has been very positive. And that’s what really motivates me!
Wow, last week I wrote a sentence that almost matches this one: “So the reception from doctors has been varied, but the reaction from patients and caregivers who I’ve shared this idea with has been very positive.”
I was referring to online misinformation fears, which hit their zenith in 2002 (did you know a cash bounty was placed on valid reports of adverse events related to the internet? Spoiler alert: that didn’t work out).
I am seeing significant parallels in this conversation and it’s both heartening & frightening. Heartening because patients and caregivers (generalizing!) grok this stuff so quickly and by looking back at history we can see that the curve is bending toward more sharing, less fear. Frightening because professionals (generalizing!) are either slower on the uptake or have a strong negative reaction to patients sharing data. Again, looking back at history, professional-class skepticism can put a real dent in other people’s hopes & dreams about information exchange.
I’m cooking up a post about this, doing some more research, so stay tuned!
I just got this great response from a coworker, and thought it was very relevant to these themes:
“Great article Katie, thanks for sharing. It reminded me of some health problems I was having a while ago. The way I documented and shared the information with doctors is very similar to yours. One funny thing I did was to draw circles on my body to explain the areas that I was having strong pain. I won’t forget the expression on Doctor’s face when I showed him the circles drawn on my arms, stomach etc.
Well my doctor wasn’t as open as yours. He thought that I was online so much and trying to know everything about health. At the end I found the solution to my problem and the cure. I actually cured myself with my own research and diet I came up with after deep research. Similar to yours I don’t use any antibiotics anymore because it causes more harm then aid to human metabolism.”
Katie, the response of your friend’s doctor is distressingly familiar, and I’m increasingly seeing it as a perverse form of oppression:
Step 1: Professionals tell patients to stay offline and stop “trying to know everything.”
Step 2: Professionals remark about how patients don’t know anything about this stuff!
If that isn’t a picture of a dysfunctional system, I don’t know what is.
Here’s a verse I said in my testimony to a panel at HHS in 2010:
“The solution is not
to restrict and constrain.
Empower the people:
enable, and train.”
Katie, I am in awe of both your inspiring motivation in your own successful tracking efforts, as well as your “tools to polish up and express (your) observations in engaging ways”, as Susannah correctly describes.
You are, it seems, an enlightened physician’s dream. You may be, alas, a not-so-enlighted physician’s nightmare. Such self-tracking may indeed be the future of medicine, but many docs have to catch up first.
You likely also still represent just a tiny minority of “average” patients out there. Doctors often lament the overwhelming reality of their patients’ “non-compliance” (love that term!) and wonder how they can motivate these patients to self-manage their own chronic illnesses, never mind get them to record info accurately and consistently to help improve their quality of life.
My experience in speaking to large groups of women on the subject of heart disease over the past four years is another example of this frustration. I’m repeatedly gobsmacked by the apparent lack of awareness and even interest among so many of the women in my audiences about their own health. This was summed up, by the way, in the 2008 Canadian LIPSTICK study; it found only 10% of women surveyed were even aware of their significant heart disease risk numbers (like blood pressure) compared to 64% who knew precisely their weight in high school! These folks are unlikely to become your average self-trackers.
As for our apparent “undertone that people are motivated to track their data by vanity or narcissism”: this is only partly true. Narcissists may be more attracted to self-tracking, but not all self-trackers are necessarily narcissists.
Maybe those who self-track the number of their individual computer keystrokes for 20 whole years may be considered by many of us to be engaging in self-absorbed behaviour. Maybe those who need to install the “Moody Me” app on their smartphones to “help users record and update how they’re feeling as often as they want” may also be similarly considered.
But self-tracking patients living with chronic disease or trying to somehow make sense of mysterious symptoms are not likely to be perceived in this camp.
regards,
Carolyn
Thank you Carolyn! I suspect that as self-tracking becomes more automated (e.g. more passive, less effort required) and is more seamlessly incorporated into our daily life, people will become aware of their personal health stats. Maybe they will even flaunt them.
Thanks for your encouragement!
I was looking for a timeline tool for psychiatry and can’t believe there’s no such thing. This timeline shows how great something like a timeline can be used. I have further ideas for how well this can be made for nurse/doctors working with acute psychiatry. Thanks! :)